Statistical news release
97,000 households move out of fuel poverty
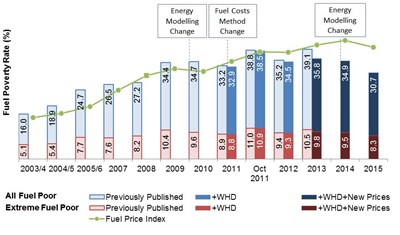
In 2015 fuel poverty rates declined by about 4 percentage points equivalent to around 97,000 fewer households living in fuel poverty compared to 2014. 30.7% or around 748,000 households were fuel poor and 8.3% (or 203,000 households) were living in extreme fuel poverty in 2015.
Statistics on fuel poverty, energy efficiency, the condition of housing, the Scottish Housing Quality Standard (SHQS) and other key descriptors of the occupied housing stock in Scotland have been released today by Scotland’s Chief Statistician. This publication provides the first release of information from the Scottish House Condition Survey (SHCS) for the year January to December 2015.
The results from the survey show that fuel poverty is on the decline following substantial drop in the price of domestic fuel.
- Just over half (2.3 percentage points) of the reduction in fuel poverty rates between 2014 and 2015 can be attributed to the lower price of domestic fuels. Around a third (1.3 points) can be attributed to improvements in the energy efficiency performance of the housing stock over this period and the rest (0.6 points) can be explained by higher household incomes.
- Households using oil as the primary heating fuel saw most improvement in fuel poverty levels in the last year, in large part due to the falling price of oil. Just over a quarter of them are now assessed as fuel poor (26%, down from 49% in 2014), which is comparable to the level of fuel poverty among those using mains gas (27%).
- Similarly, rural households have gained disproportionately in the last year with fuel poverty levels falling 15 points to 35%. Rural fuel poverty is now close to the level of fuel poverty in urban areas (30% in 2015) and the difference between the two is no longer statistically significant.
- Around half (52%) of fuel poor households have incomes above the poverty threshold, defined as £291 per week before housing costs for a couple without children. This is similar to 2014.
- Fuel poor households are more likely to report difficulties staying warm in winter. 27% of them say that their heating keeps them warm in winter “only sometimes” (20%) or “never” (8%), compared to 21% of all other households. 9% of fuel poor households report that they cannot afford to heat their home. This pattern is similar to 2014.
The survey shows a long term improvement in the energy efficiency of the housing stock, while change in the last year is less evident
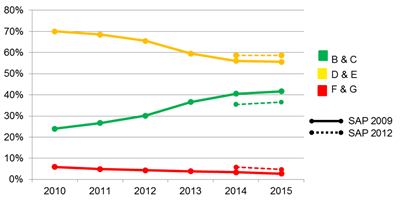
Proportion of the Scottish homes by grouped EPC Band under SAP 2009 and SAP 2012, 2010-2015
- In 2015 37% of Scottish homes were in the highest energy efficiency bands, C or better, and half had an energy efficiency rating of 65 or higher (SAP 2012). This is similar to 2014.
- In the last year the average energy efficiency rating of older properties (pre-1919), increased 3.2 points to reach 54.8. The share of electrically heated properties in band C or better increased 8 points to reach 25%.
- Using SAP 2009 shows strong improvement in the energy efficiency profile of housing in the last five years. There was a 74% increase in the share of the most energy efficient dwellings (rated C or better) between 2010 and 2015.
- The share of homes with lofts insulated to 100 mm or more was 92% in 2015 which is similar to 2014. This represents an increase of 10 percentage points on 2010 levels. Most improvement in the last year was recorded in the share of lofts with a high standard of insulation (300 mm or more). In 2015 32% of lofts were insulated to this standard, an increase of 5 percentage points from 2014.
- Levels of wall insulation remained similar to 2014. While wall insulation measures continued to be delivered under energy efficiency programmes such as ECO, sample size limitations may mean these were not picked up by the SHCS. 11% of solid wall dwellings and 71% of cavity wall dwellings were insulated in 2015. In the last 5 years the share of insulated cavity wall dwellings has grown by 9 percentage points.
Housing quality indicators remain stable at 2014 levels
- The level of disrepair remained unchanged in the last year. In 2015, 73% of all dwellings had some degree of disrepair, however minor. Disrepair to critical elements stood at 52%, 33% of dwellings had some instances of urgent disrepair, and in 8% of the housing stock some extensive disrepair was present.
- Levels of damp and condensation remained similar to 2014 levels. Around 9 out of 10 properties were free from any damp or condensation, an improvement of around 3 percentage points since 2013.
- The SHQS failure rate in the social sector was 38%, not allowing for abeyances and exemptions which are taken into account by the Scottish Housing Regulator. This has fallen from 60% in the last 5 years. 26% of social homes did not meet the Energy Efficient criterion.
- SHCS surveyors may not always be able to identify the presence of cavity wall insulation. The overall SHQS failure rate in the social sector would be 25% if it is assumed that all social dwellings have insulated cavity walls where this is technically feasible.
- The majority of dwellings falling below the SHQS failed on a single criterion; this accounts for more than 8 out of 10 failures in the social sector. For 7 out of 10 social homes which failed the SHQS this was due to falling short on a single one of the 55 elements making up the standard.
- Compliance with the tolerable standard in 2015 remained similar to 2014: 2% (or 42,000) of all dwellings fell below the tolerable standard. This represents an improvement of nearly 2 percentage points since 2012.
- Overcrowding levels in Scotland remain unchanged: 3% of all households (70,000) were living in overcrowded accommodation in 2015
NOTES FOR NEWS EDITORS
The full statistical publication can be accessed at: http://www.gov.scot/Publications/2016/12/1539
The Scottish House Condition Survey is a sample survey, hence all figures are subject to a degree of uncertainty due to sampling variability. It is a two-part survey combining both an interview with occupants and a physical inspection of dwellings. The sample size in 2015 was 2,754 dwellings where both an interview and a physical survey were conducted.
Local Authority tables giving breakdowns of key SHCS measures will be published in early 2017. Local Authority estimates use combined data over the three year survey period (2013-2015), in order to obtain suitable sample sizes.
Statistics from the SHCS are used for a variety of purposes including:
- To monitor changes in the condition of the Scottish housing stock.
- To monitor commitments to eradicate fuel poverty as far as possible by 2016 as set out in the Scottish Fuel Poverty Statement 2002, and to provide evidence of types of households vulnerable to fuel poverty.
- To monitor commitments for all social sector landlords to ensure that all of their dwellings pass the Scottish Housing Quality Standard by 2015.
- To monitor commitments to improve the energy efficiency of the Scottish housing stock to contribute to the reduction of emissions as set out in the Climate Change (Scotland) Act, 2009.
- To monitor progress on Housing and Regeneration Outcome Indicators.
- To support policy development on energy efficiency standards in the social sector (EESSH) and the private sector (REEPS); help target programmes such as Home Energy Efficiency Programmes Scotland (HEEPS) and ECO on the most vulnerable households.
Further information on Housing and Regeneration statistics within Scotland can be accessed at:
http://www.scotland.gov.uk/topics/statistics/browse/Housing-Regeneration
National statistics are produced by professionally independent statistical staff – more information on the standards of National statistics in Scotland can be accessed at:
There is a problem
Thanks for your feedback